Posted On: Friday - May 29th 2020 9:32AM MST
In Topics: Student and other Snowflakes Race/Genetics
Commenter Ganderson, with roots in the Twin Cities going back a long ways, told us of his experiences in the area over the years. Since Minneapolis has been undergoing rioting for the last couple of days (with a police station just burned down), the question of demographics was bound to come up.
The reader may be miffed at our note in the previous post, about these riots, saying:
Peak Stupidity doesn't feel a need to give numbers unless it's about something for which numbers could prove the point either way.That may sound a little arrogant, or perhaps math-shy. What it's about, is that there are basic things that a writer may know about, from common sense and experience, for which harping on the numbers may interfere with the writing of the post. What I've seen on posts on other sites is so much concentrating on stats that are obtained for any little thing via a quick look up on google/bing/duckduckgo.
The problem is that often the assumptions of these statistics must really be understood, or apples-to-oranges comparisons come about. Yet plenty of people now will do that quick search on any subject that they may know little if anything about, and think they have a definitive answer. Endless arguments ensue about which numbers are right. This is why, unless it's critical to the post, or the post is technical (like those old exercise machine posts), we often will polemicize without backing numbers for every little observation.
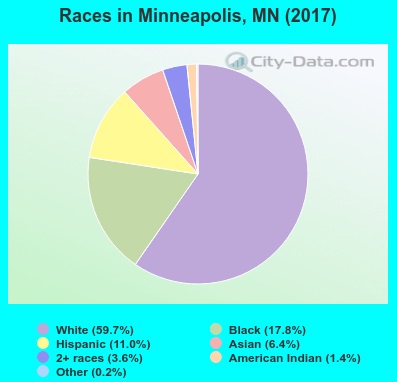
Since there was the discussion on the demographic changes in Minneapolis, I will drop in 3 graphs here. This is the near-current condition (2017):
(Unfortunately, unlike the (mostly bar-)graphs that blogger Audacious Epigone displays and discusses almost daily, Peak Stupidity does not, in general, make our own graphs. We can't have the appropriate color-coordinated ones that he does a nice job with. You've got to keep going back-and-forth to the legend with most of these graphs you find - I chalk up the extra headache to Political Correctness, of course.)
See that almost 18% sector made of, what Key Lime? This was in '17, mind you. As Ganderson and others let us know about 2 kinds of immigration, domestic out of Chicago, etc, along with the other-side-of-the-freakin' world kind, we can't expect this proportion to go anything but up. We all probably know about white demographics. (If not see "Western World committing demographic sooeee-cide" - - Part 1, Part 2, and Part 3.)
I had a hard time, in the 10 minutes I allotted until frustration set in, finding demographic history for the Twin Cities area itself, but instead I did find an excellent 31 page .pdf file (here) from the Minnesota State Demographic Center with great simple graphical data for the State. (It does have at least one graphic on Hennepin County.)*
From that source, here is what all we really need with regard to the riots. The darkest line is for the Twin Cities.
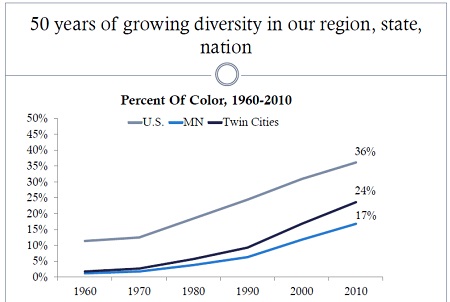
Yes, sometimes a blind duckducker finds a nut. Mr. Ganderson relates that Minneapolis had its riots in the 1960s when, who didn't, after all? I don't dispute it. They had to have gotten every lunch counter clerk and barber around to come out though, as this graphs shows something like a 2% black population there. Here's a graph of the metro area population:
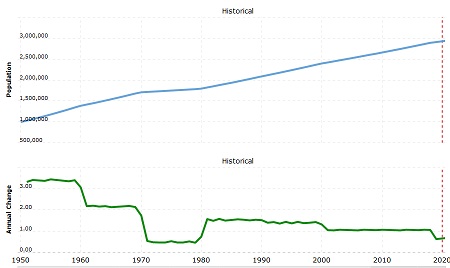
In 1965, with 1 1/2 million people in the area, I guess you could still get a good riot up with 1/10 of all the black population - say 3 thousand people. Now, with a 18% proportion of nearly 3 million people in the area , 1% of the black population "turning out" would still get you nearly 5 thousand. They're a much better area to host a riot now, those Twin Cities are!
ADDENDUM: See this post was rushed earlier, and here's that a bit of that apples-to-oranges part. Upon noting that the 2nd graph has % "People of Color", not just black people as its value, yet 24% vs. the 18% for near the current year that I used, it makes one wonder about the difference. After all, the pie chart has another over 22% more POC (Hispanic, Asian, American Indians and 2+ races, I guess)! However, Hispanic is not a race we are told, and we hear tell of white ones and black ones. This is where one throws up one's hands, as even if they were all white, the 24% POC from the line graph minus the 18% black in the pie chart doesn't equal those 11.4% of the other 3. But, then the pie graph may be for the city of Minneapolis proper (kinda likely, I think), while the line graph tells you the population in question for each of the 3.
So unless one wants to get really into it, and spend 1/2 to a full day on these posts learning stuff that one doesn't necessarily care to learn the details about, it's all kind of rough numbers. I'm in this neither to write a Master's Thesis in Sociology that will get rejected due to racism nor to make a Ron Unz type 20 single-spaced page article. That's why I round off a lot. Suffice it to say, the black proportion of the population of the general area has got to be near 10 x what it was in the mid-1960s.
* If a reader has the time to go into the MN State Demo Center site itself, he may very well be able to find some good interactive graphs to produce all kinds of great stuff. See page 26, in which it's obvious one can at least select by county. I'm just out of time for right
********************************************
[UPDATED 05/29:] Had to go quickly and had looked at the last graph too quickly. There were 1 1/2 million, not 1 million in the Minneapolis-St. Paul metro area in 1965, per the graph, so that'd be in the ballpark of 3-4 thousand coming out if 1 in 10 black people did. That's a BIG number, the 1 in 10, as most people are decent.
Added a link to that .pdf too.
Added last 2 paragraphs - ADDENDUM.
********************************************
Comments:
Moderator
Saturday - May 30th 2020 1:05PM MST
PS: Thank for the laugh, Robert.
Jimbo
Saturday - May 30th 2020 7:27AM MST
PS: https://rairfoundation.com/exposed-ilhan-omars-daughter-isra-hirsi-retweets-dsas-request-for-riot-supplies-in-minneapolis/
https://www.masslive.com/sports/2020/05/college-football-hall-of-fame-damaged-looted-during-riots-in-atlanta-following-protests-over-death-of-george-floyd.html
https://www.masslive.com/sports/2020/05/college-football-hall-of-fame-damaged-looted-during-riots-in-atlanta-following-protests-over-death-of-george-floyd.html
Robert
Friday - May 29th 2020 3:56PM MST
PS:
Re: The problem is that often the assumptions of these statistics must really be understood, or apples-to-oranges comparisons come about.
Yes. This is a big problem. My favorite statistic: People with bigger feet spell better.
Re: The problem is that often the assumptions of these statistics must really be understood, or apples-to-oranges comparisons come about.
Yes. This is a big problem. My favorite statistic: People with bigger feet spell better.
A nonviolent solution is probably to separate the cities from the US, in a free-city arrangement. Who will have the courage to propose it first on a national stage?