Posted On: Wednesday - March 10th 2021 7:26PM MST
In Topics: Economics Inflation
Wow, it's been 2 3/4 years, or 11 quarters as the economists would call it, since Peak Stupidity posted anything about this housing bubble 2.0 (on the West Coast, at least). Not only that, but I saved the images below 2 months ago to make this post then. I guess we've got enough stupidity to go around.
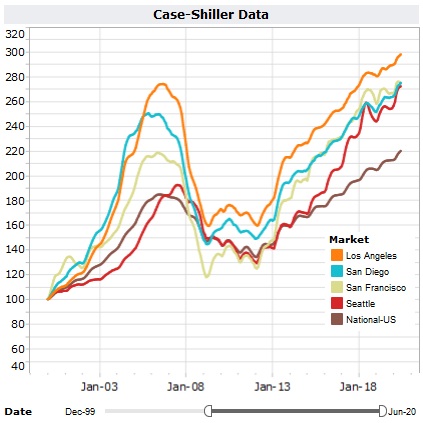
As with the last 2 times, I get this information from the Seattle Bubble web site, mainly because "The Tim" how writes it has the best graphs to play with. The data is called "Case-Schiller data" because those two economic analysts first compiled this median home price data with their year 2000 index-100 for 20 US cities' metro areas and price data referenced to that year as a ratio. In this way, the trends in the prices can be compared from city to city without regard to absolute price. In that first post (on "West Coast, University towns, minorities hardest hit") I gave lots of info. on the Seattle Bubble site. Here's a repeat of a bit:
This is more information that could be gleaned from regular readings of Zerohedge and sites like that over the last few years. Peak Stupidity would like to give a shout-out, if you will ("shout-out", only phrase heard from Øb☭ma that I liked) to a site called Seattle Bubble that this writer first perused way back in 2005. By the name, this guy, called "The Tim", writes specifically about Seattle, Washington, but he covers the overall scene with housing prices in his graphs - more about them shortly.So, yeah, this guy does the work, and I just enjoy perusing his less-and-less-frequent posts on this Case-Shiller data. Yeah, I just looked - the guy barely blogs anymore. He used to put up the newest (2-month old) data every month. This data is from his post of late August '20, and it has data from June '20, 3 quarters ago.
Unfortunately, I'm not completely consistent in keeping the same regions of the country, as in same metro areas together in these 3 posts. They are in general comparable though, you really don't need the old data, and lastly, I'm not about to do it again today. I'll point out cities for which the legend's color scheme has them way too close to being the same colors.
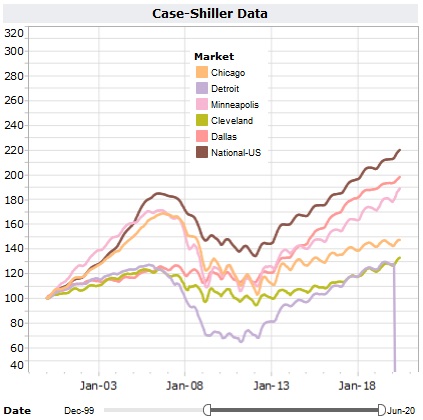
Oh, that's an artifact at the end of the Detroit curve. It did not just get nuked (just to be sure, you know), as one might gather from that big decline. In general, in real estate it's all location, location, location, but it one day could be radiation, radiation, radiation! ;-}
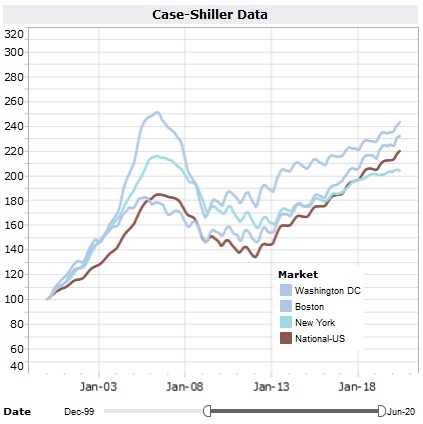
The higher grey-blue curve is Washington, FS, and the lower one is Boston, Mass.
I'll state here that for most of the country, calling these numbers a housing bubble has probably been a mistake. Sure, they all have been climbing reasonably steeply since housing prices started rising again in '12. Is it just that inflation has been a considerable amount more than the US BLS (or BS) numbers of 1-2% that they've been giving us for decades? Check out our Inflation topic key for lots more on the subject.
I'm glad I accidentally left that national average curve in with each set, actually as the reader can see that curve in comparison. I get a rise of 80% of the C-S index from '12 to '20. That comes out to a 7.6% annual inflation rate with annual compounding, pretty significant. Granted, the start of this was perhaps a low point, but who knows? Starting from 2000 (index = 100 by definition), we get a 170% increase over 20 years. That gets us 2.7% compounded annually. That's higher, but sounds lots closer to the purported inflation rates, but then I maintain that the first half of the '00s did not have very much inflation. It's the last 10 to 15 years in which we seem to be getting pounded.
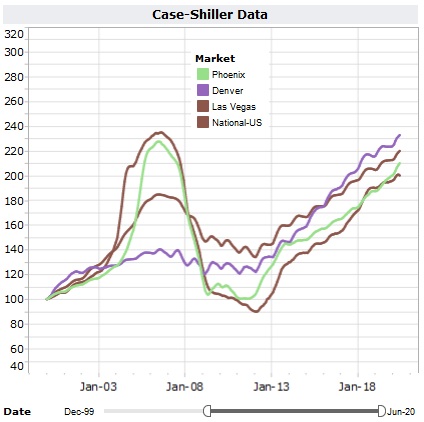
Going back to bubble terminology it's the West Coast cities where the housing prices are climbing the steepest. Back to the time since prices bottomed out ('09 - '12) I get San Diego prices up 83% (just above the national average), meaning a 7.8% compounded annual rate, Los Angeles -- 88%/ 8.2%, Seattle -- 109%/9.6%, and San Francisco -- 120%/10.3%. That's steep. They've got the Chinese money coming in over there.
No matter whether it's a bubble that will burst again or we just have pretty high inflation in housing prices, we are getting screwed. All I can do is put on a Ron Paul Liberty Report video, tap my heals together, and say 3 times END! THE! FED!
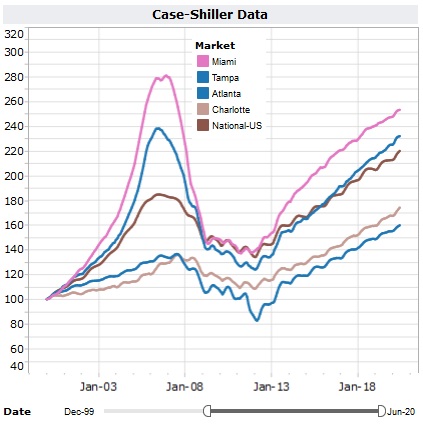
* Yeah, I did mean to write that. Miami and Tampa? Not Southern.
Comments:
Moderator
Friday - March 12th 2021 9:13AM MST
PS: For all, I don't think where I live is really a bubble, and we are near the national average. How about saying we have a bubble in the US Dollar, which WILL pop? I'm seeing inflation everywhere. Other people have such short memories, or they just don't care to keep track in their heads of anything. "I dunno, you just pay what they ask."
I will write another post on this, but also another on gasoline prices. The bottom line is that I learned about 5 years ago to quit predicting anything in that regard.
I will write another post on this, but also another on gasoline prices. The bottom line is that I learned about 5 years ago to quit predicting anything in that regard.
The Alarmist
Thursday - March 11th 2021 9:27AM MST
PS
It’s both inflation and a bubble at the same time. At some point they’ll turn off the credit spigot to the average Joe and Jane who, of not already on the propert ladder already, will be stuck in their rented government assigned flats, or moving back in with the folks, and they will be happy about owning nothing.
The rest of us will become billionaires on paper, but will never be able to buy a loaf of bread with what is left of our savings after inflated property taxes are cleaned out our Treasury-Direct or Fed-Direct accounts.
MBlanc46
Thursday - March 11th 2021 9:17AM MST
PS Of course, it’s a bubble. In a financialized economy, everything is a bubble. The only serious question isn’t When will it burst? No one knows.
Bill H
Thursday - March 11th 2021 8:33AM MST
PS Bubble. No matter how many times the "experts" say that "this time it's for real," it is absolutely a bubble.
My house sold new for $53,000 forty years ago. I bought it for $173 twenty-five years ago. It now assesses at $550,000. That is absurd.
The VALUE of my house has not changed since it was built. It provides no more shelter now than it did then. Actually, its VALUE has dropped, since it needs quite a bit of repair. Its PRICE has increased because some idiot is willing to pay that much for it. What happens when there is no idiot willing to pay that much? That is the definition of a bubble.
Moderator
Thursday - March 11th 2021 1:04AM MST
PS: Good point, Peter. That brings me to Mr. Hail's question. Answer: The metropolitan areas. I'll write that in.
Hail
Wednesday - March 10th 2021 9:03PM MST
PS
Is the data for cities-proper or metro areas?
Is the data for cities-proper or metro areas?
PeterIke
Wednesday - March 10th 2021 8:41PM MST
PS
“the Detroit curve. It did not just get nuked (just to be sure, you know)”
How could anyone tell the difference?
“the Detroit curve. It did not just get nuked (just to be sure, you know)”
How could anyone tell the difference?
The country has more people. Some places can, or are allowed to, have housing spread out and some can't or aren't. It's all location, but then, what makes a place a good location can change...
Will people run out of money to pay $550,000 for houses like yours? If the dollar stayed worth something, no, I agree, the musical chairs game can be called over again. If it doesn't, well $550,000 just won't be a lot of money anymore, so people may be glad to.