Posted On: Monday - February 20th 2017 8:49AM MST
In Topics: University Global Financial Stupidity
During last class the discussion was of a philosophical bent - what is the purpose of a university, who should pay for it, and how should the service rendered be measured. This time we come to the crux of the financial problem here - the US Government-backed school loans.
We use many anecdotes here at PeakStupidity, but it is good to see numbers too. Believe me, ZeroHedge lays out the numbers pretty regularly for this story. Since this is my blog, and I don't want to keep referring to the hundreds of links it would take to get the gist of it, I'll put a few graphs here shortly. First though, just to put this University Financial Bubble in perspective, back in the mid-'80's even, tuition at a state university that I am familiar with cost from $1000 to $1200 /semester, only one in 3 or 4 students had loans of any sort (except possibly from family), and one could work his way through college, including food money and a room with a decent summer job, though it could be supplemented by 1/4 time work during the school year. Yeah, kids today (!), they don't want to hear "I just worked for my college money during the summer, no problem - you kids today, what's wrong with ya'?" No, you can't do this today, and more about that to come.
This graph shows the drastic increase in money borrowed for college, but won't match some latter stuff, due to the fact that this is just Direct Government Loans.
(It's interesting that the number took off like a rocket just after the housing-bubble-burst/stock-market-crash of 2008. Parents of college students probably felt pretty wealthy with the big bucks "Equitized" in their McMansions before that - some of the kids may have gone to school off their parents' HELOCs (Home Equity Lines of Credit). Also, people must have felt pretty confident to spend with their 401ks jacked up with the market - that was one round, we are in another round now.)
Here is a closer up graph of one decades worth, and older one that ends in 2013. The 2012 y-value on this graph does not match that on the last one, due, again, to the last being only US-Gov't-Direct ones. This one shows total student loans including from private banks, BUT, the private ones are backed by the Feds, and this is the root of the problem - explanation coming. Let me give you an approximate number from 2016 - 1.4 Trillion big ones. The number is still increasing at a high rate.
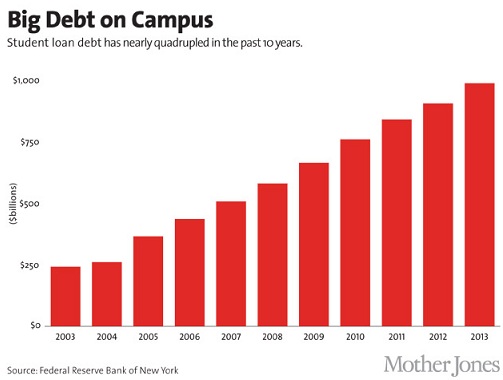
( I see this came from an article in "Mother Jones", ugggh, but they didn't make the graph.)
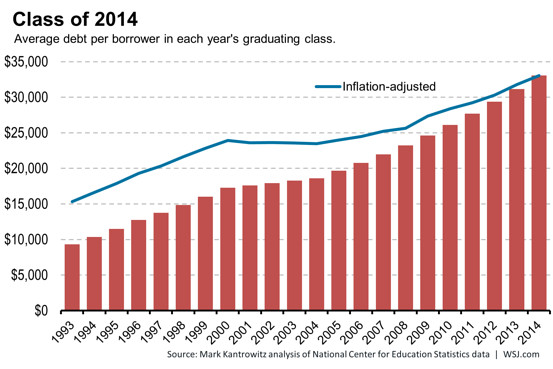
Now, granted there are more and more college students each year until peak stupidity, due to both the false assumption that any degree will still get one a decent job, but also due to the influx of foreigners - they are not in the financial picture here, except by increasing college revenues even more. Therefore, the next graph will show borrowed amounts per student, which shows us more about the effect of this loan situation on individuals:
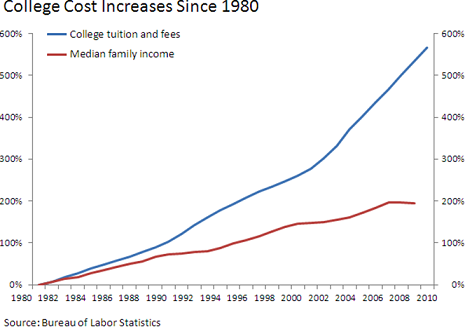
The last graph here shows the large increase in tuition (and FEES, which can be very significant for part-time students, as these fees are fixed regardless of the number of credits taken in a semester), along side a graph of increases in family income. That's a big disparity.
So those graphs just show the overall trend, and the $1,400,000,000,000 in total loans outstanding last year sometime, along with information about defaults, will fill in the rest of the numbers.
The next post on this, hopefully today, will discuss the what the real problem is, and the root cause.
Comments: